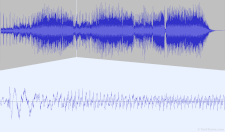
Waveform
A waveform is a visual representation of an audio or electrical signal that charts the amplitude, or strength of a signal, over time. Audio editors, such as DAWs, display waveforms for recorded audio tracks to provide a snapshot of each recording. Electrical monitoring equipment uses waveforms to visualize voltages or currents in electrical circuits.
The most basic form of an audio wave is a sine wave, which oscillates smoothly at a consistent frequency. Other examples of generated waves include square waves (which instantly switch between two values), triangle waves (whose amplitude rises and falls at a constant rate), and sawtooth waves (where the amplitude either slowly rises then abruptly falls, or vice versa). Recorded audio waves are far more complex, since multiple sounds added together overlap, creating complex waves that don't oscillate smoothly or at a consistent frequency.

You can get a lot of information about an audio signal by viewing its waveform. The amplitude reflects how powerful the sound is — a short waveform is quiet, while a tall waveform is loud. The frequency at which the signal oscillates between maximum and minimum values also affects the sound. The faster the frequency, the higher-pitched the sound.
Noticeable changes in a waveform are also indicators of when certain parts of a recording take place. For example, the waveform of a musical performance may start small when a single vocalist is singing, then get larger when instruments join in. The waveform often peaks when percussive notes, such as drums, are played. This visual representation enables audio editors to locate certain parts of a song without even listening to the recording.
NOTE: Signals can also be viewed as waveforms plotted against frequency, rather than time. Waveforms representing the frequency domain — also called "frequency spectrums" — show how much of a signal's energy is present at different frequencies at a given point in time.
 Test Your Knowledge